You’re minding your own business, when suddenly:
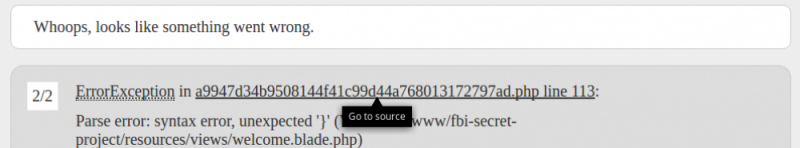
xdebug stack trace in laravel
Great, an error in a compiled view. Wouldn’t it be awesome if we could click the stack trace, and open that file and line number immediately in PHPStorm? The answer is yes, it would be.
In fact, this feature is so useful, hacky workarounds have existed for years to get this feature. Today, we have first-class support with PHPStorm and Xdebug.
Setup xdebug
Setting up xdebug on most Unix machines should be straightforward:
1 | $ sudo apt-get install php-xdebug |
$ sudo apt-get install php-xdebug
If you are running an old version of PHP or have an interesting setup, take a look at the Xdebug install guide. Just know that although that guide covers usage of PECL, odds are you don’t need to if you aren’t partial to it and are OK Googling around.
Setup xdebug.file_link_format
Xdebug versions greater than 2.1 have support for file_link_format: a way of specifying what files should link to. You get two handy attributes, %f and %l, to specify the file and line number in the link. Here’s an example link that most tutorials use today:
1 | xdebug.file_link_format="phpstorm://open?file=%f&line=%l" |
xdebug.file_link_format="phpstorm://open?file=%f&line=%l"
Were you to use this in your php.ini configuration and reload your server, you’d see the stack trace links go to something like this:
1 | phpstorm://open?file=/var/www/project&line=55 |
phpstorm://open?file=/var/www/project&line=55
Easy! Except the PHPStorm protocol itself is hard to configure properly (especially for FireFox users). In fact, I wasn’t able to get it to work at all, despite some existing tutorials claiming it works! That’s fine there is an easy workaround, first add this to your server’s php.ini file:
1 2 3 4 5 6 7 | [xdebug] xdebug.remote_enable = 1 xdebug.remote_host=localhost xdebug.remote_port=9000 xdebug.file_link_format = "http://localhost:63342/api/file/%f:%l" xdebug.idekey=PHPSTORM xdebug.remote_autostart=1 |
[xdebug]
xdebug.remote_enable = 1
xdebug.remote_host=localhost
xdebug.remote_port=9000
xdebug.file_link_format = "http://localhost:63342/api/file/%f:%l"
xdebug.idekey=PHPSTORM
xdebug.remote_autostart=1
(Psst.. on Ubuntu-flavored machines, look in /etc/php/{{version}}/apache2/ if you are on Apache)
The necessary parts are explained below:
| remote_enable | If true, Xdebug attempts to contact any debugger clients listening on the ole listenin’ port. |
| remote_host | This actually defaults to localhost already, but it’s worth mentioning if you are doing remote debugging. Can be left out. |
| remote_port | Default is 9000 already, mentioned for remote debugging. |
| file_link_format | The prize pig that lets stack traces link to custom URLs. But wait! Instead of using the phpstorm:// protocol, see that it instead uses the PHPStorm API. PHPStorm as a service listens on port 63342 and has its own API to interact with the IDE (you can do quite a bit! manage tasks, todos, open links, etc) |
| idekey | Optional, but worth mentioning if you have multiple debug clients |
| remote_autostart | Hey if you liking setting cookies to start Xdebug, that’s awesome, leave this out. Otherwise start Xdebug automatically on each request by setting this to 1. |
Save and reload your server config; make sure PHPStorm is open. Cause an exception and try clicking on a file name in the stack trace. The IDE opens the file at that specific line:
top secret bug: CAUGHT
One minor gripe: clicking a link opens it in the same tab, so you’ll need to press the Back button afterward.
Opportunities: Endless
There are some fun hacks with Laravel DebugBar in opening even more cool things with file_link_format – the opportunities are endless!